Docs
Search
Search
Help & Feedback
Get Started
Functionality
Learning
Extension
Dev Tooling
APIs
Releases
Average Order Items Metric
Home
/
By Type
How-to Guide
Step-by-step guides to achieve a specific scenario or setup.
Author:
Movyn John
Changed on:
13 Oct 2025
Key Points
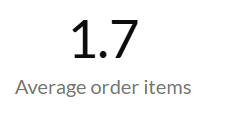
The Average Order Items for the selected time period
Steps
Related content
Fluent Metrics Library Overview
The Fluent Metrics Library is a collection of metrics and dashboards available to Fluent customers. Delivered through the Fluent Analytics feature, it gives retailers real-time visibility into order, fulfillment, returns, and inventory operations to enable faster, smarter decisions.
Designed for retail operations managers, inventory analysts, business intelligence, and many other teams who need visibility across retail operations.
Average Order Value Metric
Total Orders Metric
Top 10 Products Fulfilled Metric
Movyn John
What it measures
Average number of items per order for the selected time period.
When to use this metric
Monitor cross-selling and upselling effectiveness
Assess shopping cart optimization strategies
Plan picking and packing operations
Evaluate product bundling and recommendation success
How to interpret
Good performance: Increasing items per order indicates successful cross-selling
Potential issues: Declining items per order may suggest poor product recommendations
Benchmark guidance: Varies significantly by industry; track trends more than absolute values
Key considerations
Higher items per order generally improve profitability through shared shipping costs
May be influenced by promotional strategies and seasonal buying patterns
Bundle deals and sets can artificially inflate this metric
Technical details
Formula:
SUM(order.items.quantity) / COUNT(orders) within the selected time period
Configuration:
none